Data Collection Methods:
· Chemical testing kit – tests for D0, pH, temp, turbidity, nitrates, phosphates.
· Chemical testing kit – tests for D0, pH, temp, turbidity, nitrates, phosphates.
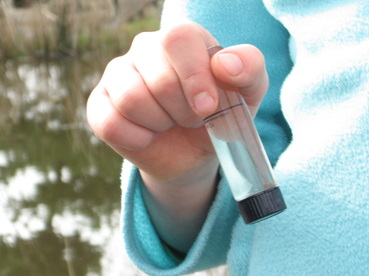
This is Hanna testing Dissolved Oxygen. We have to test it so we can figure out how much oxygen there is in the water. This is to see if life can live in the water.
|
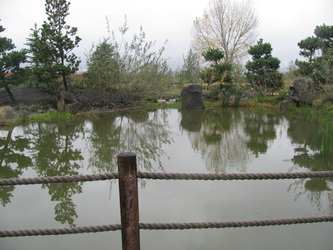
This is the Experimental Wetlands. This is the source of the first water quality test site. We tested each sample of dO, pH, nitrates and phosphates. We hope you learn new things from our website!
|
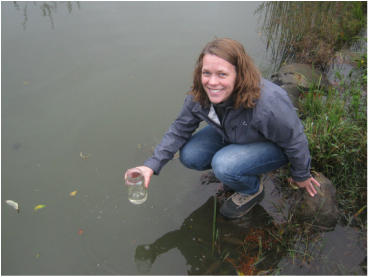 This is Ely collecting water samples.
Unlike temperature and DO, the persence of normal level of NITRATES usually does not have a direct effect on aquatic insects or fish.
If too much phosphates are in the water, then algae and weeds will grow rapidly, and close the waterways. This can result in loss of oxygen. This is Ely collecting water samples.
Unlike temperature and DO, the persence of normal level of NITRATES usually does not have a direct effect on aquatic insects or fish.
If too much phosphates are in the water, then algae and weeds will grow rapidly, and close the waterways. This can result in loss of oxygen.
|
Findings
|
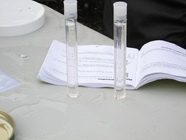
This is us testing pH and Phosphates. Phosphates can come from soap and pH is whether the water is acidic or basic.
|
|
|
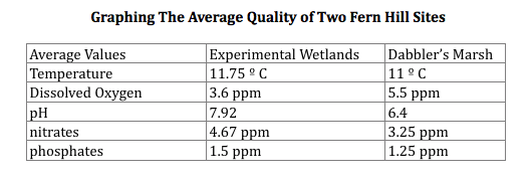
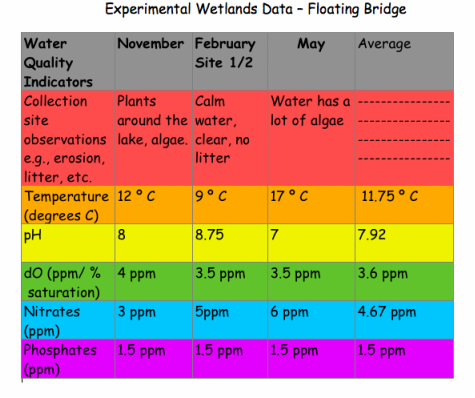
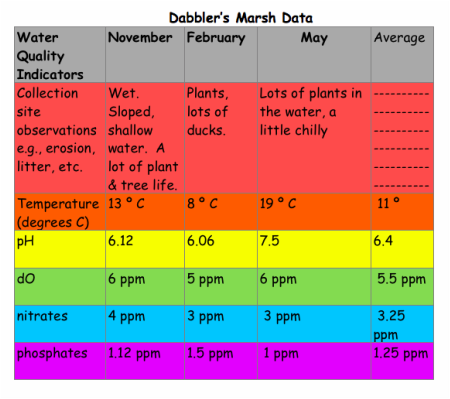
These tables show our Dabbler's Marsh data set and our Experimental Wetlands data set. The top table shows how they compared.
Here are some interesting things we noticed:
- Temperature dropped in the winter and rose a lot in May.
- Dissolved oxygen was higher in Dabbler's Marsh. Nitrates were higher in the Wetlands.
- Phosphates were the same every time we went to the floating bridge.
Here are some interesting things we noticed:
- Temperature dropped in the winter and rose a lot in May.
- Dissolved oxygen was higher in Dabbler's Marsh. Nitrates were higher in the Wetlands.
- Phosphates were the same every time we went to the floating bridge.
|
Conclusion
Our hypotheses was wrong. The floating bridge testing site had worse water quality. This means it's better for animals to live in Dabbler's Marsh. But I wonder why the experimental wetlands was worse, even though the experimental wetlands are treated? We will have to continue testing the water to find out. Reflection Our Water Quality research was challenging and took a lot of time, but was really fun. I really enjoyed testing with my friends, but the waiting really did me in. There was so much waiting! I learned that science experiments aren't easy. We should keep going back to the wetlands to see if it stays healthy. -Hunter |
|
