Amazing macros
Introduction
Fernhill is a Wetland. It has a lot of habitat for wildlife. It is a great place for taking a walk and having a picnic. The water there is the reason so many species make their homes there. We can tell the water is good just by looking at the macros!
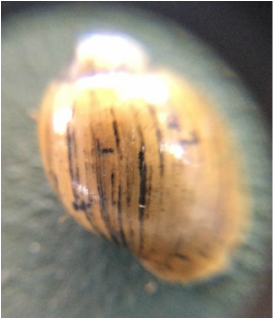
When I say "macros" I mean macro invertebrates - small aquatic animals are an indicator species. That means they can help us tell whether water quality is good or not. One good macro is a Mayfly, it is a very sensitive and only lives in clean water. One bad macro is an aquatic worm, it is very tolerant to poor quality water.
At Fernhill, our group has been working to see if the Experimental Wetlands or Dabbler's Marsh has a greater diversity of macros. Our findings show which of these water sources has higher quality water.
Fernhill is a Wetland. It has a lot of habitat for wildlife. It is a great place for taking a walk and having a picnic. The water there is the reason so many species make their homes there. We can tell the water is good just by looking at the macros!
When I say "macros" I mean macro invertebrates - small aquatic animals are an indicator species. That means they can help us tell whether water quality is good or not. One good macro is a Mayfly, it is a very sensitive and only lives in clean water. One bad macro is an aquatic worm, it is very tolerant to poor quality water.
At Fernhill, our group has been working to see if the Experimental Wetlands or Dabbler's Marsh has a greater diversity of macros. Our findings show which of these water sources has higher quality water.
Question
Are a greater diversity of aquatic macroinvertebrates found in Dabbler’s Marsh or in the Experimental Wetlands?
Data Collection Methods:
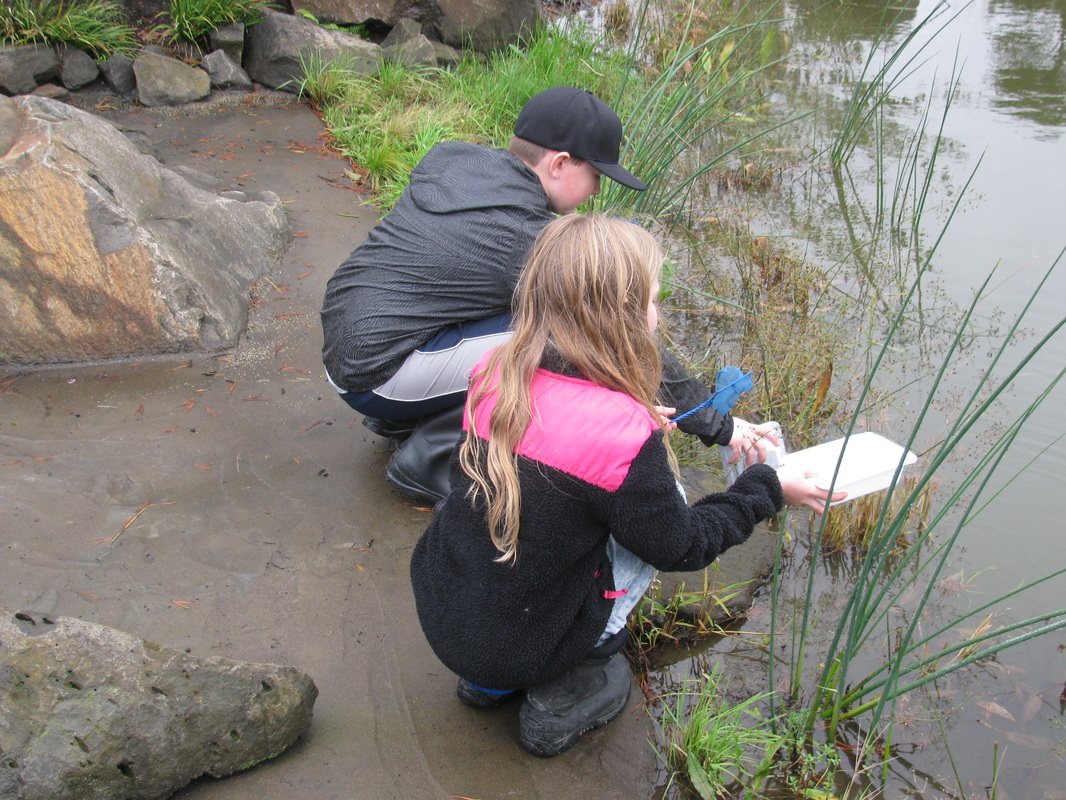
· Netting with d net(big net) , clip net(small net), identification
· Calculate biotic index to estimate water quality
. Put the macros in sorting trays using spoons(droppers if hard to get),Count the number of macro species, repeat with different species
. Half time at each site
Findings
Are a greater diversity of aquatic macroinvertebrates found in Dabbler’s Marsh or in the Experimental Wetlands?
Data Collection Methods:
· Netting with d net(big net) , clip net(small net), identification
· Calculate biotic index to estimate water quality
. Put the macros in sorting trays using spoons(droppers if hard to get),Count the number of macro species, repeat with different species
. Half time at each site
Findings
Reflection
This project was fun. We learned a lot and had a good time. One highlight was working together to find macros. A hard challenge was getting macros on our third visit in May. From that, we learned that we just need to go with it and get whatever data we can. We should keep coming to Fernhill to see the awesome macros and do experiments. |
Findings
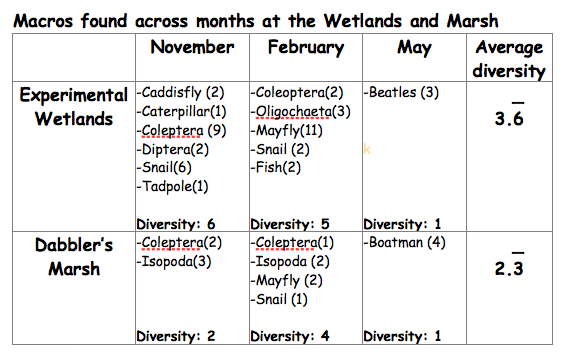
Notice that February had the most diversity and best results. That is when the most sensitive macros can be found in the Wetlands. In May, we weren't able to find very many macros at all - only two! The Experimental Wetlands had the best and most sensitive macros. Conclusion We found more diversity of macros overall in the Experimental Wetlands. That might mean that the water is better there than in Dabbler's Marsh. We only found 2 macros in May - that could have been because because the reconstruction made the water dirty, or because other wildlife may have done things to the water. We also noticed that Clean Water Services had turned on the waterfall in May, which may explain the changes we observed. We wonder how the macros are going to react next year as the restoration project continues. |
